


This article first appeared in Capital, The Edge Malaysia Weekly on November 2, 2026 - November 8, 2026
While nine months is not a long time for a new index, it can still provide useful insight into whether it is capturing the characteristics it was designed to identify.
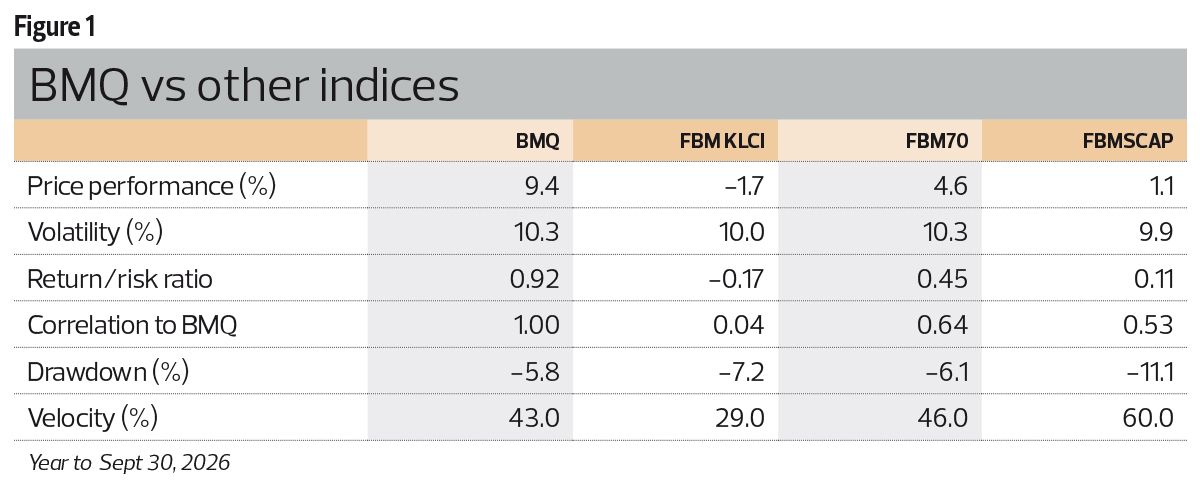
In the first nine months of the year, the Bursa Malaysia Quality 50 Index (BMQ) has gained 9.4%. Over the same period, the FBM KLCI declined 1.7%, the FBM Mid 70 Index (FBM70) rose 4.6% and the FBM Small Cap Index (FBMSCAP) climbed 1.1%.
Rather than selecting companies based on market capitalisation, the BMQ was designed to identify businesses with stronger financial characteristics through a systematic assessment of three key measures of quality:
• Profitability through return on equity (ROE);
• Capital structure through the debt-to-equity ratio (D/E); and
• Earnings quality through operating cash flow relative to profit after tax and minority interest (OCF/Patami).
These reflect familiar questions for investors: Is the business generating attractive returns? Is leverage prudent? Are reported earnings backed by cash generation?
The BMQ applies these measures systematically across a broad universe of listed companies to identify those exhibiting stronger profitability, healthier balance sheets and better earnings quality. Its first nine months provide an early opportunity to see what happens when that methodology meets the real market (see Figure 1).
Geopolitical developments in West Asia, energy price fluctuations, shifting monetary policy expectations and bouts of risk-off sentiment in the first nine months of 2026 provided a real test for companies with quality factors.
An obvious question might be whether the BMQ’s stronger performance simply came with higher risk. The data suggests it did not. Annualised volatility was 10.3%, identical to the FBM70, and slightly higher than the FBM KLCI’s 10.0% and the FBMSCAP’s 9.9%.
With volatility broadly similar, the BMQ’s stronger return carried through to risk-adjusted performance. It recorded a return-to-risk ratio of 0.9, the highest of the four indices, compared with -0.2 for the FBM KLCI, 0.4 for the FBM70 and 0.1 for the FBMSCAP.
For investors, the more interesting observation is not simply how much the BMQ returned, but that the stronger return was achieved without materially higher volatility.
Beyond market size: what distinguishes the BMQ?
The BMQ’s strongest relationship among the benchmark indices was with the FBM70 and FBMSCAP, with correlations of 0.6 and 0.5 respectively, compared with 0.04 for the FBM KLCI. This naturally raises the question of whether the index’s stronger performance simply reflects its exposure to Malaysia’s mid- and small-cap universe.
The underlying characteristics of the constituent companies suggest otherwise. BMQ constituents recorded an average ROE of 17.4%, higher than the FBMSCAP’s 13.2% and more than double the 7.6% recorded by the FBM70. Average total debt-to-equity stood at 15.8%, compared with 72.9% for the FBM70 and 57.5% for the FBMSCAP.
These differences are significant. While the BMQ shares a meaningful relationship with the mid- and small-cap universe, the companies selected through its quality screen exhibit markedly higher profitability and substantially lower leverage than the broader FBM70 and FBMSCAP.
The early evidence therefore suggests that the BMQ is not simply a proxy for mid- and small-cap exposure. Its constituents also display the financial characteristics targeted by the quality screen.
Beyond the performance discussion, the index also demonstrates how quality investing can be applied systematically. Rather than evaluating profitability, balance-sheet strength and earnings quality company by company, investors can gain exposure to these characteristics through a rules-based index framework.
Quality that can be invested in
For an index to be useful in practice, those companies must also form a sufficiently sizeable and liquid investment universe.
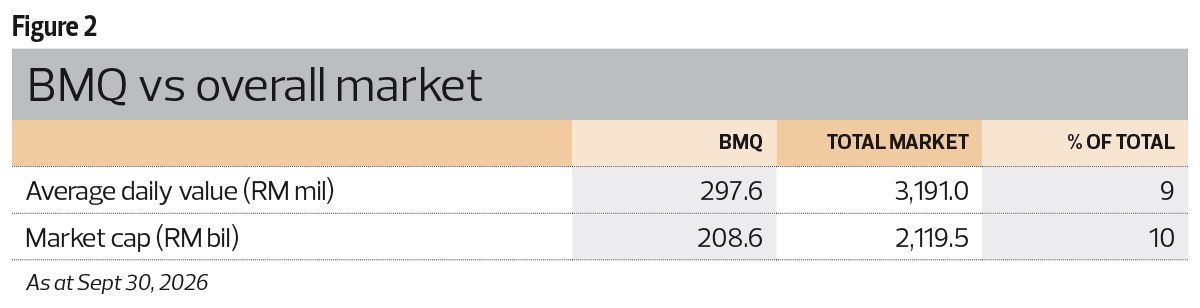
On that measure, the BMQ is not a niche basket. As at Sept 30, 2026, its constituents had a combined market capitalisation of RM208.6 billion, or about 10% of Bursa Malaysia’s RM2.1 trillion market capitalisation, and generated RM297.6 million in average daily trading value (ADV), equivalent to around 9% of total market ADV of RM3.2 billion.
Liquidity is also built into the index methodology. BMQ constituents are required to have a minimum 12-month trading velocity of 10%. In practice, the index recorded a velocity of 43%, above the FBM KLCI’s 29% and not far below the FBM70’s 46%, while the FBMSCAP stood at 60%.
For institutional investors and exchange-traded fund managers, this is important: the BMQ’s stronger financial characteristics sit within a sizeable and sufficiently liquid universe.
Nine months in, the full-cycle test remains
While the first nine months is too short to prove that quality will always outperform, they do indicate that the BMQ is capturing the characteristics it was designed to identify: stronger profitability, healthier balance sheets and better earnings quality, while remaining liquid and investable.
A full market cycle will provide a more complete assessment of how quality characteristics behave across different market, economic and interest-rate environments.
Nevertheless, the early results suggest that quality can offer a different lens through which to view the Malaysian equity market, complementing traditional market-cap-based benchmarks.
Stephanie Tan is director of group commercial and market coverage at Bursa Malaysia Bhd
Save by subscribing to us for your print and/or digital copy.
P/S: The Edge is also available on Apple's App Store and Android's Google Play.