

This article first appeared in The Edge Malaysia Weekly on September 7, 2026 - September 13, 2026

The pace of progress in artificial intelligence (AI) has been extraordinary. Just a year ago, generative AI was still largely used as a chatbot — useful for answering questions, summarising documents or generating snippets of code. Today, tools such as Anthropic’s Claude Code and OpenAI’s Codex can operate much more like agents: they can read files, write and modify codes, run programs, debug errors and carry out multi-step tasks with relatively little human intervention.
That shift from AI that merely answers questions to AI that can actually execute tasks has unlocked an entirely new set of capabilities. Programming is perhaps one of the clearest examples. People with little or no formal coding background can now describe what they want in plain English and have an AI agent build a website, create a database or write Python programs to analyse millions of data points — work that was simply impractical on Excel and required programming skills to execute.
These new AI capabilities do more than help companies automate labour-intensive tasks, cut costs and improve efficiency. They also give businesses the ability to create entirely new products and services that would previously have been too difficult, costly or technically demanding to build.

With that in mind, we have been exploring how to combine the power of AI with the extensive database we have built over the years covering Malaysian-listed companies. The objective is simple: to turn a large amount of financial and market data into insights that can be useful to ordinary investors.
One area we have been experimenting with is algorithmic investing. In its simplest form, algorithmic investing means using a computer program that has a predefined set of rules to determine what stocks to buy and sell, and when. These rules can range from relatively simple to highly complex. For example, an algorithm can be programmed to auto-select the stock to buy when certain technical indicators are triggered or exploit small and temporary price differences between related securities through statistical arbitrage.
The appeal of algorithmic investing lies in the consistency it brings to the investment process. Instead of relying on gut feel, market rumours or emotions, investors use predefined rules to screen stocks, determine when to enter or exit a position, and apply the same process repeatedly over time. This helps reduce behavioural biases, makes investment decisions more systematic and, importantly, allows investors to process far more data than would be possible manually.

Finding the right algorithm with the help of AI
We began by compiling share price, trading volume and financial data for all Malaysian-listed companies over a five-year period, from February 2021 to February 2026, for backtesting.
Next, we applied predefined screeners on a weekly basis over this entire period. For every stock that passed the filter, we then calculated its subsequent one-, two- and four-week share price returns.
We tested different combinations of filters covering both momentum and fundamental indicators — factors that commonly influence share price movements. These include changes in share price and trading volume as measures of momentum, net profit growth as a measure of growth, and return on equity (ROE) as a measure of business quality.
We then varied the thresholds for each parameter with the objective of identifying the combination that was associated with the strongest subsequent returns.
After testing hundreds of combinations, we found that the strongest results came from stocks that satisfied the following five criteria:
- Have a market capitalisation of at least RM500 million;
- Saw average daily trading volume at least double from the preceding four-week average;
- Share price was higher than a week earlier;
- Reported latest-quarter earnings growth equivalent to more than 0.2% of its market capitalisation; and
- Achieved an ROE of at least 10%.
In essence, companies that met all five criteria were fundamentally strong businesses that had recently reported earnings growth and, at the same time, were seeing a sharp increase in investor buying interest — and this was reflected in both higher trading volumes and rising share prices.
During the entire duration of our backtest period, about five stocks met all five criteria each week. These stocks beat the FBM KLCI by 0.5% after one week, 0.8% after two weeks and 1.2% after four weeks, on average.
Beating the index by 1.2% every four weeks is an extraordinary result. If sustained consistently, it translates into an annual outperformance of roughly 16% over the benchmark index (there are 13 four-week periods in a 52-week year).
The question is, can the strategy work in the real world once trading costs, bid-ask spreads and execution are taken into account? To find out, we opened a live trading account and began putting the screener to the test with real money.
Testing the algorithm with a live portfolio
We started a live trading account with RM100,000 in initial capital. Knowing that the strategy would involve multiple transactions every week, we paid particular attention to brokerage costs when choosing where to open the account. We selected a broker that charges a commission of just 0.03% per trade, with no minimum commission, plus a RM3 platform fee.
At the end of every trading week (on Friday), the algorithm generated a fresh list of stocks that met our five criteria. We bought these stocks at the market open on the following Monday, held them for four weeks and sold the entire cohort before the end of the trading day on the Friday of the fourth week.
Since our strategy was to hold each weekly cohort for four weeks, we split the RM100,000 capital into four equal portions. The first RM25,000 was fully invested in the first week — in equal amounts for each stock, depending on the number of stocks generated — the second RM25,000 in the second week, and so on.
For instance, if there was only one stock generated for that week, then the entire RM25,000 would be invested in this stock. If there were two stocks, then we would buy RM12,500 worth of each stock. The capital deployed in the first week would be released at the end of the fourth week — the RM25,000 plus or minus gains/losses after the stocks are sold — and recycled into a new batch of stocks in the fifth week.
The portfolio made its first purchase on March 30, 2026 and has since completed 49 transactions. A transaction is considered completed after the stock has been bought, held for the full four-week period and sold; stocks that are still within their holding period are excluded.
After accounting for brokerage fees, clearing fees and stamp duty, 26 of the 49 completed transactions were profitable, while 23 recorded losses. Although the win rate was only slightly above 50%, the distribution of returns was positively skewed. Eight stocks generated gains of more than 10%, including four that rose by more than 25%. By contrast, only two stocks lost more than 10% — one falling 10.1% and the other 12.9% (see chart).
This asymmetry of returns helped drive the portfolio’s 13.3% gain as at Aug 21, 2026, after less than five months from inception. The portfolio is sitting on RM10,312 in realised gains and RM2,955 in unrealised gains. In comparison, the FBM KLCI delivered a total return of just 3.4% during the same period. In other words, our portfolio outperformed the benchmark index by almost 10%.
Positive asymmetry was by design
The positive asymmetric results were what we would expect because of the combination of filters applied. By requiring all five criteria to be met, the screener naturally filters out less compelling investment cases, such as companies whose volume spike was caused by selling pressure, loss-making companies that are attracting speculative buying interest, companies with a weak profitability track record despite a recent jump in earnings, or high ROE companies whose earnings have stagnated. In other words, the criteria systematically rejected the type of stocks that lose big.
- By requiring companies to meet the minimum 10% ROE, we are building a “safety net”. These are profitable and capital-efficient companies. If the share price drops, value investors would step in, thereby putting a floor under its price. This limits our downside.
- Earnings growth = 0.2% of its market capitalisation means that the company must show absolute profit growth (not just in percentage terms). In short, its share price increase is fundamentally driven.
- Market cap = RM500 million filters out volatile penny stocks.
- Share price > previous week’s price plus positive earnings — we avoid buying stocks whose prices are falling and losing money, which can lead to massive drawdowns.
- The four-week holding period is a “sweet spot”.
In a nutshell, we designed the algorithm so that potential gains would be significantly larger than potential losses.
It’s about expected returns: We don’t have to be right all the time
The key takeaway from this experiment is that AI is an incredibly useful tool that few can afford not to use. And we must use all the tools available at our disposal, AI or otherwise, to do our jobs faster and better. If used well, AI can give us that competitive advantage — always bearing in mind that we must retain judgement and decision. In our case, AI helped us test hundreds of combinations of ideas efficiently, while only requiring minimal technical resources. But we decide the final criteria.
The algorithmic investing results are encouraging. The portfolio gained 13.3% in less than five months — equivalent to an annualised return of 33% — compared with a 3.4% total return for the FBM KLCI. Naturally, there is a caveat: this is no guarantee of future results. But we are upbeat. As we said, the algorithm is designed to favour positive asymmetric returns.
Only slightly more than half of the stocks in our portfolio ended up profitable after their respective four-week holding periods. However, the gains from the winners were, on average, significantly larger than the losses from the losers. This asymmetry enabled the algorithm’s overall selections to outperform the market.
What this also means is that one must buy every qualifying stock and not cherry-pick. Discipline is the key. The rules must be applied consistently, regardless of personal opinion on any individual stock. The other critical consideration is that the trading platform used must offer sufficiently low commissions for the frequent buy and sell strategy to be viable.
Investing is about probabilities and expected returns. We don’t have to be right in every stock pick, or even most of them — a few big winners can more than offset many more losers. This dovetails with our belief of why the AI-led equity rally, where investors are betting on both incumbents and challengers, is not irrational. For sure, there must inevitably be some double counting of the potential future profits. But we think that the few eventual AI winners will win huge, and that will more than offset the failures and losses.
We will now sell all the remaining stocks once they complete their requisite four-week holding periods and close this experimental trading account. But the experiment itself will continue in public. Every Saturday morning, beginning Sept 5, we will publish on theedgemalaysia.com the stocks selected by the same algorithmic screener. Anyone can follow the selections, read about them and track how they perform. It will be completely free. No subscription, no fee, no catch.
Conclusion
We will do this for another three months, and then we will stop altogether. Why? Because our intention was never to give direct investment advice, manage other people’s money or turn this experiment into an investment product. Our role is to serve the public good: to help make our capital market more informed, transparent, efficient and resilient.
In this experiment, as in much of what we do, our purpose is to teach, analyse and demonstrate. What we wanted to show is how AI can be an extraordinarily effective enabler — allowing ordinary people to analyse vast amounts of data, test ideas rigorously and do things that, until very recently, required substantial technical skills and resources.
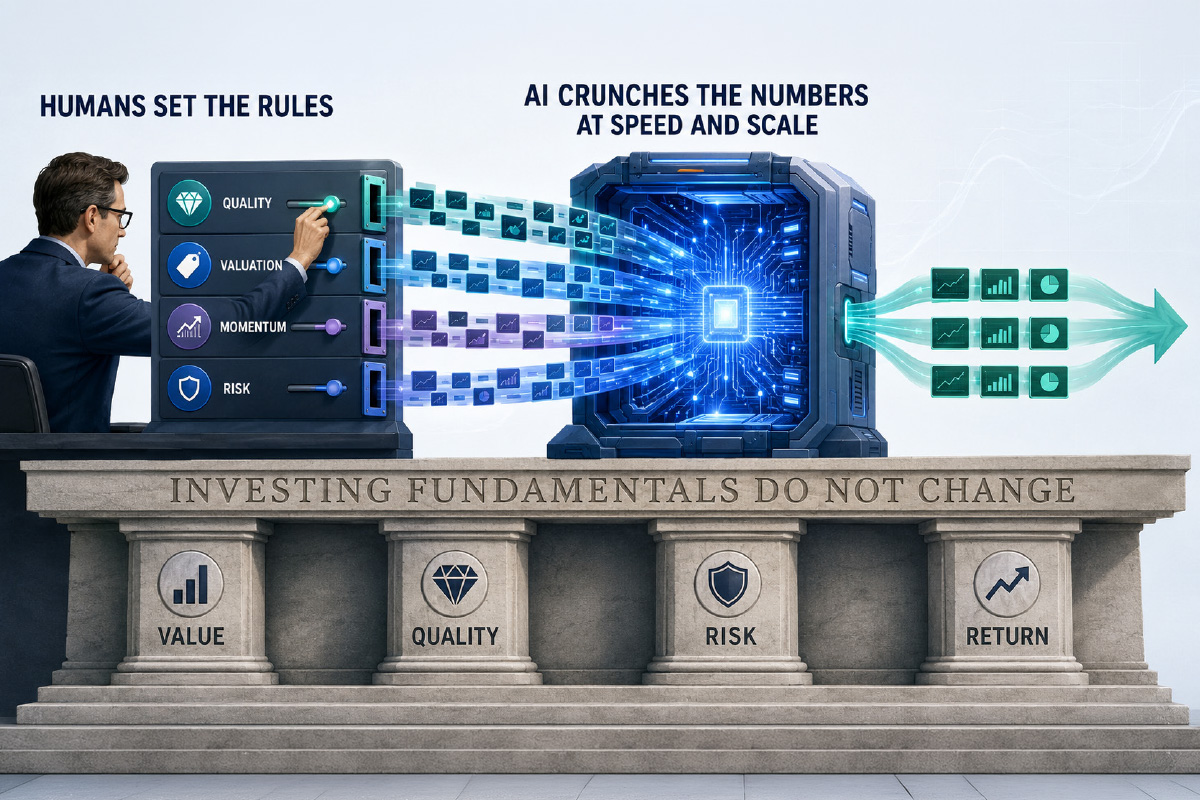
And perhaps the most important lesson is not about AI at all. It is about investing. Investing is about discipline, probabilities, expected returns and managing risk against reward. It is about constructing situations where, as far as possible, “heads I win, tails I don’t lose much”. That is also why fundamentals still matter even when the strategy trades on momentum: momentum may tell us when to enter, but fundamentals help protect us when momentum turns. AI can process the data, test hundreds of combinations and enforce the rules. But the principles behind those rules — and ultimately the judgement — remain ours.

Portfolio commentary
The Malaysian Portfolio fell 1.6% for the week ended Sept 2, though faring better than the benchmark FBM KLCI, which was down 2.3%. The only winners for the week were United Plantations (+4%) and Kim Loong Resources (+0.7%). Public Bank (-4.3%), LPI Capital (-2.7%) and Hong Leong Industries (-1.9%) were the notable losers. Total portfolio returns now stand at 215.4% since inception. This portfolio is outperforming the benchmark FBM KLCI, which is down 6.6% over the same period, by a long, long way.
The Absolute Returns Portfolio, meanwhile, ended 1.4% lower for the week, paring total portfolio returns to 31.2% since inception. Shares for Nvidia Corp (+7%), Microsoft Corp (+0.1%) and Berkshire Hathaway (+0.1%) bucked the broader market downtrend while the top losers include Sun Hung Kai Properties (-7.9%), Alibaba Group Holding (-5.8%) and Schneider Electric (-4.7%).
The AI Portfolio was also down last week, losing 4.9%. The loss reduced total portfolio returns to 19.6% since inception. The sole gainer was Broadcom, Inc (+3.3%), while the biggest losing stocks were Marvell Technology, Inc (-15.8%), Cadence Design Systems (-8.4%) and Datadog (-8.1%).
Disclaimer: This is a personal portfolio for information purposes only and does not constitute a recommendation or solicitation or expression of views to influence readers to buy/sell stocks. Our shareholders, directors and employees may have positions in or may be materially interested in any of the stocks. We may also have or have had dealings with or may provide or have provided content services to the companies mentioned in the reports.
Save by subscribing to us for your print and/or digital copy.
P/S: The Edge is also available on Apple's App Store and Android's Google Play.