

This article first appeared in Capital, The Edge Malaysia Weekly on April 14, 2025 - April 20, 2025
LAST week’s market rout brought back memories of previous stock crashes. We look back at the major stock market declines of the last four decades, from the cause and depth of the routs to their eventual recovery.
Black Monday (1987)
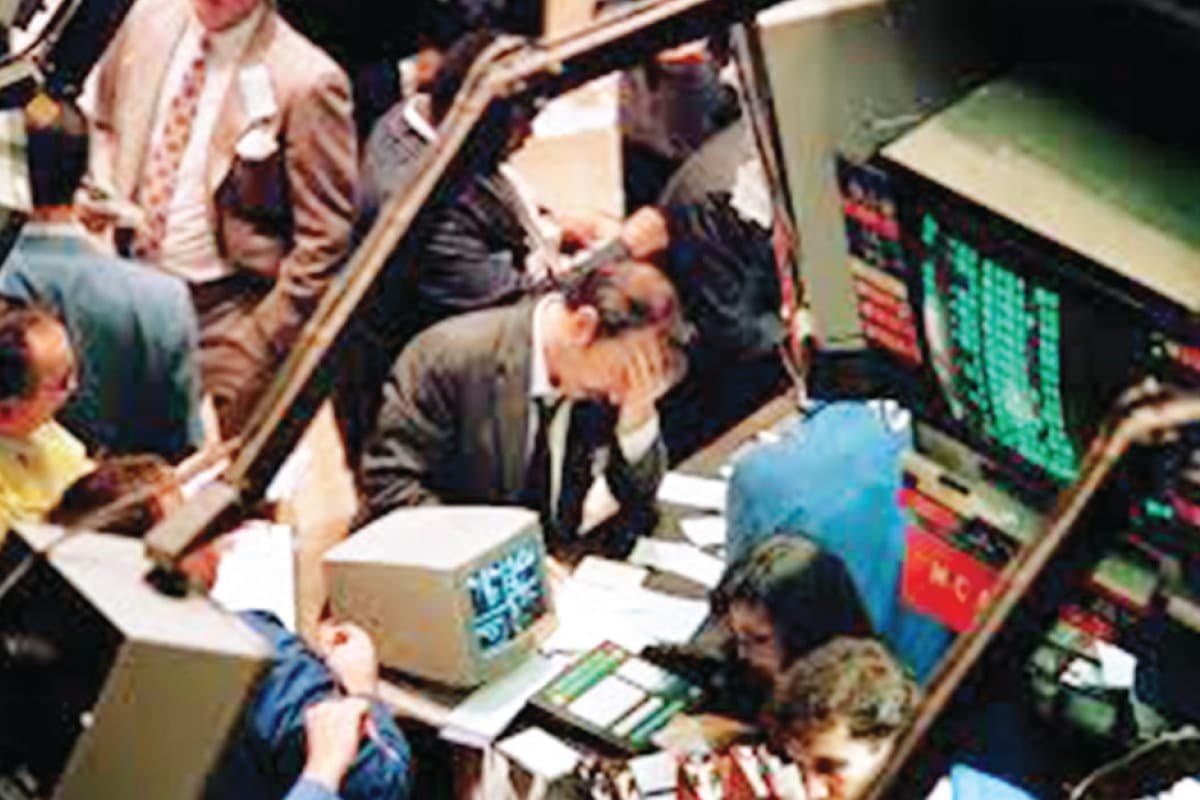
On Oct 19, 1987, Wall Street experienced its sharpest single-day percentage drop — a day that came to be known as “Black Monday”. The Dow Jones Industrial Average (DJIA) plunged 22.6% (508 points) due to panic selling.
The crash was driven by multiple factors, including a weakening US dollar, rising interest rates, overvalued equities, and concerns over trade and budget deficits.
Investor confidence faltered when then Treasury Secretary James Baker hinted at a possible dollar devaluation as bond yields rose. Even before the US markets opened on Oct 19, Asian stocks had already begun plunging.
The DJIA was particularly vulnerable, having surged 44% in the first eight months of 1987, driven by growing international investor participation in preceding years.

Portfolio insurance, a novel strategy at the time that extensively utilised options and derivatives, gained significant popularity but ultimately worsened the downturn. Adding to the chaos, structural flaws in stock, options and futures markets contributed to negative trading balances, intensifying the crash.
The crisis prompted immediate responses from central banks and regulators. The US Federal Reserve, led by chairman Alan Greenspan, moved quickly to reassure markets by injecting liquidity and pledging to support the banking system.
The day after Black Monday, the Kuala Lumpur Composite Index or KLCI dropped 15.7%, or 56.24 points. Over the following two months, it continued to decline, shedding an additional 135.43 points, or 37.8%, to reach a lower low. While the US market also showed weakness during this period, it did not break a new low.
The DJIA returned to its pre-crash level in September 1989, nearly two years after Black Monday, while the KLCI achieved full recovery in October 1989.
The 1987 crash led to the introduction of circuit breakers to prevent a recurrence of similarly rapid and steep market declines.
Asian financial crisis (1997-1998)
The Asian financial crisis (AFC) erupted in July 1997 when the Thai government abandoned its fixed exchange rate regime, triggering a rapid baht devaluation that sent shockwaves across the region. The crisis quickly spread to neighbouring countries — earning it the term “contagion” and causing widespread financial instability.
Before the crisis, the Asean economies had experienced years of rapid expansion through foreign capital inflows and credit growth. However, structural weaknesses — such as over-leveraged corporations, fragile banking systems and large current account deficits — left them vulnerable. These vulnerabilities became apparent as investor confidence faltered, leading to a mass exodus of foreign capital.

As foreign investors withdrew en masse, currencies collapsed, interest rates soared and equities suffered deep sell-offs. Up to September 1998, Thailand’s SET Index lost nearly 85% from its February 1996 high, while Indonesia’s JSX Composite plunged over 90% in USD terms as the rupiah depreciated more than 80%.
Over the same period, the KLCI shed around 75% of its value, while the ringgit faced immense pressure. Meanwhile, the Philippine Stock Exchange Index (PSEi) suffered losses exceeding 75%.
Malaysia notably rejected help from the International Monetary Fund (IMF), opting instead for capital controls and pegging the ringgit to the US dollar in 1998. Countries that accepted IMF assistance included Indonesia, South Korea and Thailand.
In response to the crisis, Malaysia set up a national asset management company Danaharta and Danamodal, a recapitalisation agency. It also established a debt restructuring body — the Corporate Debt Restructuring Committee — to address instability in the financial system.
Recovery took nearly a decade for most markets. The KLCI regained its 1997 peak in February 2007, followed by the PSEi in May 2007. Indonesia, in USD terms, recovered its losses in February 2008. Thailand’s SET, however, required nearly 17 years to recover from the AFC losses, eventually reclaiming them in January 2013. The AFC led to major reforms in many of the affected countries, including improved financial regulations and enhanced transparency in the banking sector.
Notably, the AFC led to consolidation of the country’s financial institutions, proposed by Bank Negara Malaysia in 1999, in efforts to stabilise and strengthen the banking system.
The US markets were largely unscathed throughout the AFC. While the DJIA dropped 12.4% in October 1997 amid concerns of global contagion, it quickly rebounded. By early 1998, the index had fully recovered and resumed its upward trajectory, reaching 9,300 in July 1998 before continuing its ascent, ultimately peaking at 11,750 in 2000.
Dotcom bubble (2000)
The mid-1990s was an era of boundless optimism over the internet’s potential. Investors flocked to any company with a “.com” following its name, often disregarding the viability of its business model or profitability.
As internet access expanded, start-ups rushed to go public, fuelled by venture capital funds and little more than a website or an idea. Valuations skyrocketed, driven by future projections rather than actual earnings. Both institutional and retail investors believed they were witnessing a technological revolution and wanted to be a part of it.
Global optimism surrounding technology stocks extended to the local market, where companies in telecommunications and internet services — such as the rapidly expanding Maxis Communications and the newly established Malaysian Internet Exchange (MyIX) — attracted investor interest.

The Nasdaq Composite Index, home to technology stocks, surged from 1,000 points in 1995 to over 5,000 by March 2000. However, in early 2000, the Fed raised interest rates to cool an overheating economy, shifting investor sentiment and eventually bursting the internet bubble.
By March 2000, the market peaked, and doubts surfaced about unprofitable tech companies with unclear paths to profitability. Panic selling ensued, and over the next two years, the Nasdaq plunged 80%, dropping from its March 2000 high of 5,048 to a low of 1,114 by October 2002.
Recovery, however, was slow and painful. While the other broader US indices began to rebound after the crash, the Nasdaq, which had been most heavily hit, took much longer to recover. It wasn’t until 2015 that the Nasdaq finally regained its pre-crash peak, a full 15 years after the bubble burst.
Meanwhile, the KLCI, which primarily tracked traditional sectors such as banking, plantations, and oil and gas, was also impacted. Beginning in March 2000, the index entered a downward trend, declining 41.6% to a low of 553.34 by April 2001. This downturn was largely driven by the broader economic slowdown, as the US slipped into a recession from March to November 2001.
Global financial crisis (2007-2008)
The global financial crisis (GFC) of 2007-2008 was one of the most severe economic downturns in modern history, marked by a sharp decline in global stock markets. It has its genesis in the US housing bubble, fuelled by subprime mortgage lending, financial deregulation and excessive risk-taking by banks.
In the mid-2000s, US financial institutions issued high-risk subprime mortgages to borrowers with poor credit, betting on continuously rising home prices. Banks repackaged these risky loans into mortgage-backed securities (MBS) and collateralised debt obligations (CDOs), selling them to investors globally.
As US home prices declined in 2007, the value of these financial products collapsed, triggering massive losses for banks and investors. The crisis culminated in Lehman Brothers’ bankruptcy in September 2008, sending shockwaves through global markets and sparking a sustained sell-off.

The stock market decline intensified in 2008, with the DJIA plunging 54% from its October 2007 peak to its March 2009 bottom. European markets suffered steep losses due to their banks’ significant exposure to MBS.
Meanwhile, Asian banks, though less directly exposed, were impacted by global financial linkages and trade dependence, leading to Asian markets declining between 40% and 65%, varying by country.
Recovery was varied across regions. In the US, the Fed and government took decisive action, including bailing out major financial institutions, implementing fiscal stimulus and slashing interest rates to near-zero levels.
Meanwhile, stimulus-driven demand from China fuelled a commodity boom, particularly in crude oil and palm oil prices, which accelerated the FBM KLCI’s recovery. The index regained its GFC peak losses of 42.4% by July 2010, nearly 2½ years ahead of the US market.
The DJIA returned to its pre-crisis level by March 2013, nearly five years after bottoming out. Other global markets took longer, with most major stock indices recovering by 2014.
European debt crisis (2010-2012)
The European debt crisis emerged in the aftermath of the 2008 GFC, shifting concerns from private-sector debt to sovereign debt within the eurozone. By late 2009, investor anxiety grew as Greece’s budget deficit soared to 12.7% of GDP, far exceeding the European Union’s (EU) 3% limit.
This led to credit rating downgrades, prompting investors to reassess lending risks to other highly indebted European nations. By 2010, the crisis escalated as Greece neared default, triggering intervention from the EU and the IMF with a €110 billion bailout package.
Similar rescue plans followed for Ireland in 2010 and Portugal in 2011, though the bailouts came with strict austerity conditions, which worsened economic contractions and fuelled public opposition. Investor confidence deteriorated further, with fears of debt contagion spreading to larger economies like Spain and Italy, leading to a broad equity market sell-off.

In just seven months, the Euro Stoxx 50 index, which represents the largest eurozone companies, plunged more than 30%, dropping from its February 2011 peak to its September 2011 low. Banking stocks suffered particularly due to their heavy exposure to sovereign bonds and concerns over recapitalisation needs.
Over the two-month period from July 2011, the DJIA dropped 15.3%, while the FBM KLCI fell 15.8%, as heightened volatility rippled through global markets.
A turning point came in July 2012, when European Central Bank (ECB) president Mario Draghi pledged to do “whatever it takes” to preserve the euro, reassuring markets and signalling stronger monetary support. The crisis gradually eased with ECB measures like its Outright Monetary Transactions (OMT) programme.
The US stock market rebounded more quickly, with the DJIA recovering its losses by early 2012, which in turn helped the FBM KLCI regain its losses by March 2012. European equities, however, took longer, with the Euro Stoxx 50 only returning to its 2010 levels by late 2013.
Covid-19 pandemic (2020)
The Covid-19 stock market crash began in late February 2020 as the virus spread beyond China to the US and Europe, sparking fears of a global pandemic.
The US DJIA saw its first major drop on Feb 24, plunging nearly 1,000 points (3.6%). Volatility worsened in early March, as the crisis saw three “Black Days” in the US — March 9, 12 and 16 — when steep declines triggered circuit breakers, halting trading.
Just a day after the US began implementing lockdowns to curb the virus’ spread on March 15, the DJIA fell 2,997 points (12.9%) — its largest single-day point drop since 1987.
Panic selling intensified globally, leading to activation of circuit breakers as Covid-19 cases surged, lockdowns expanded and oil prices collapsed, exacerbated by a price war between Russia and Saudi Arabia. The Philippines even became the first country to suspend stock market trading entirely.

From its Feb 12 high, the DJIA plummeted over 37%, reaching a low of 18,591.93 points on March 23 — the steepest and fastest decline in its history, pushing the market into bear territory within weeks. Within a month, the FBM KLCI plunged 20.5%, reaching 1,219.72, its lowest level in 10 years.
However, market recovery was swift, driven by aggressive policy measures from central banks and governments. On March 15, the Fed slashed interest rates to near zero and launched large-scale quantitative easing programmes. Less than two weeks later, the US government enacted the Coronavirus Aid, Relief and Economic Security (CARES) Act, a US$2.2 trillion stimulus package to support businesses, workers and the healthcare system.
Beyond liquidity injections into the market, optimism surrounding reopening plans and vaccine development further boosted investor confidence.
The FBM KLCI rebounded earlier, in July 2020, fuelled by strong rallies in glove stocks Top Glove Corp Bhd (KL:TOPGLOV) and Hartalega Holdings Bhd (KL:HARTA).
The DJIA, meanwhile had recovered much of its losses by September 2020. It then continued its upward momentum, reaching the historic 30,000-point milestone on Nov 24, just eight months after its March low.
What is the ‘fear gauge’?
The VIX Index, known as the “fear gauge”, measures market volatility based on S&P 500 options pricing. It incorporates out-of-the-money (OTM) options across various strike prices to estimate expected volatility over the next 30 days, reflecting investors’ forward-looking sentiment on market fluctuations.
A low VIX (<15) suggests market stability, often seen in bullish trends, while a high VIX (>30) signals heightened uncertainty, typically during economic crises or major sell-offs. The index moves inversely to equities — spiking during sharp market declines as put options gain demand.
Technical analysts watch VIX spikes, as extreme readings indicate capitulation and potential turning points. In addition, the VIX futures curve may offer insight into risk sentiment.

Historical peaks include October 2008 (GFC) at 89.53 and March 2020 (Covid-19 crash) at 85.47. The yen carry trade unwinding in August last year recorded the third-highest VIX reading at 65.73. More recently, US President Donald Trump’s reciprocal tariffs drove the VIX to 60.13.
Other past crises, including the Asian financial crisis, dotcom bubble and European debt crisis, saw the VIX rise to just under 50.
Save by subscribing to us for your print and/or digital copy.
P/S: The Edge is also available on Apple's App Store and Android's Google Play.