

This article first appeared in The Edge Malaysia Weekly on November 7, 2022 - November 13, 2022
A couple of weeks back, we explained why we thought global stock prices had yet to bottom and why it was not yet time to buy (see “Are stocks cheap enough yet?”, The Edge, Issue 1444, Oct 24). Since then, more than half of US companies have reported 3Q2022 earnings results. While the overall results were not as bad as feared, they do point to a worsening trend — a trend that we think will persist for a few more quarters at least, as the slowdown in economic activities accelerates under the weight of a steep rise in costs and interest rates.
Analysts have continued to pare back their forecasts, albeit slowly. Profits are now expected to grow 6.1% in 2022 (driven mainly by energy earnings) and 6.4% in 2023, down from 7.9% and 8.2% respectively in early September. Critically, net margins have now fallen in the past five consecutive quarters — to 12% currently since peaking at 13.1% in 2Q2021 — yet analysts are still expecting them to expand over the next three quarters, to 12.5% by 2Q2023. As we wrote previously, this projected profit margin expansion — into a rising costs and interest rate environment, as well as what will most likely be a global economic recession — is surely unrealistic.
Indeed, while banks did better than expected last quarter — net interest margins were boosted in the rising interest rates environment — Big Tech provided ominous warnings on the outlook ahead. The latter are, arguably, better canaries in the proverbial coalmine, given their broad customer base, both businesses and consumers. For instance, the slowdown in business spending on cloud computing services and advertising, as well as consumer spending, is foretelling bleaker earnings ahead for the rest of the economy.
In short, we think stock prices have yet to adequately reflect the high odds of earnings contraction in a US and global recession. As such, we believe there remains significant downside risks to stock prices. But what of bonds? We do get asked this question often and, so far, we have mostly written about stocks. So, this week, we decided to write an elementary article on bonds. For this, we take a closer examination of the historical correlation between stocks and bond prices for insights.
Stocks and bonds were positively correlated over the last 25 years
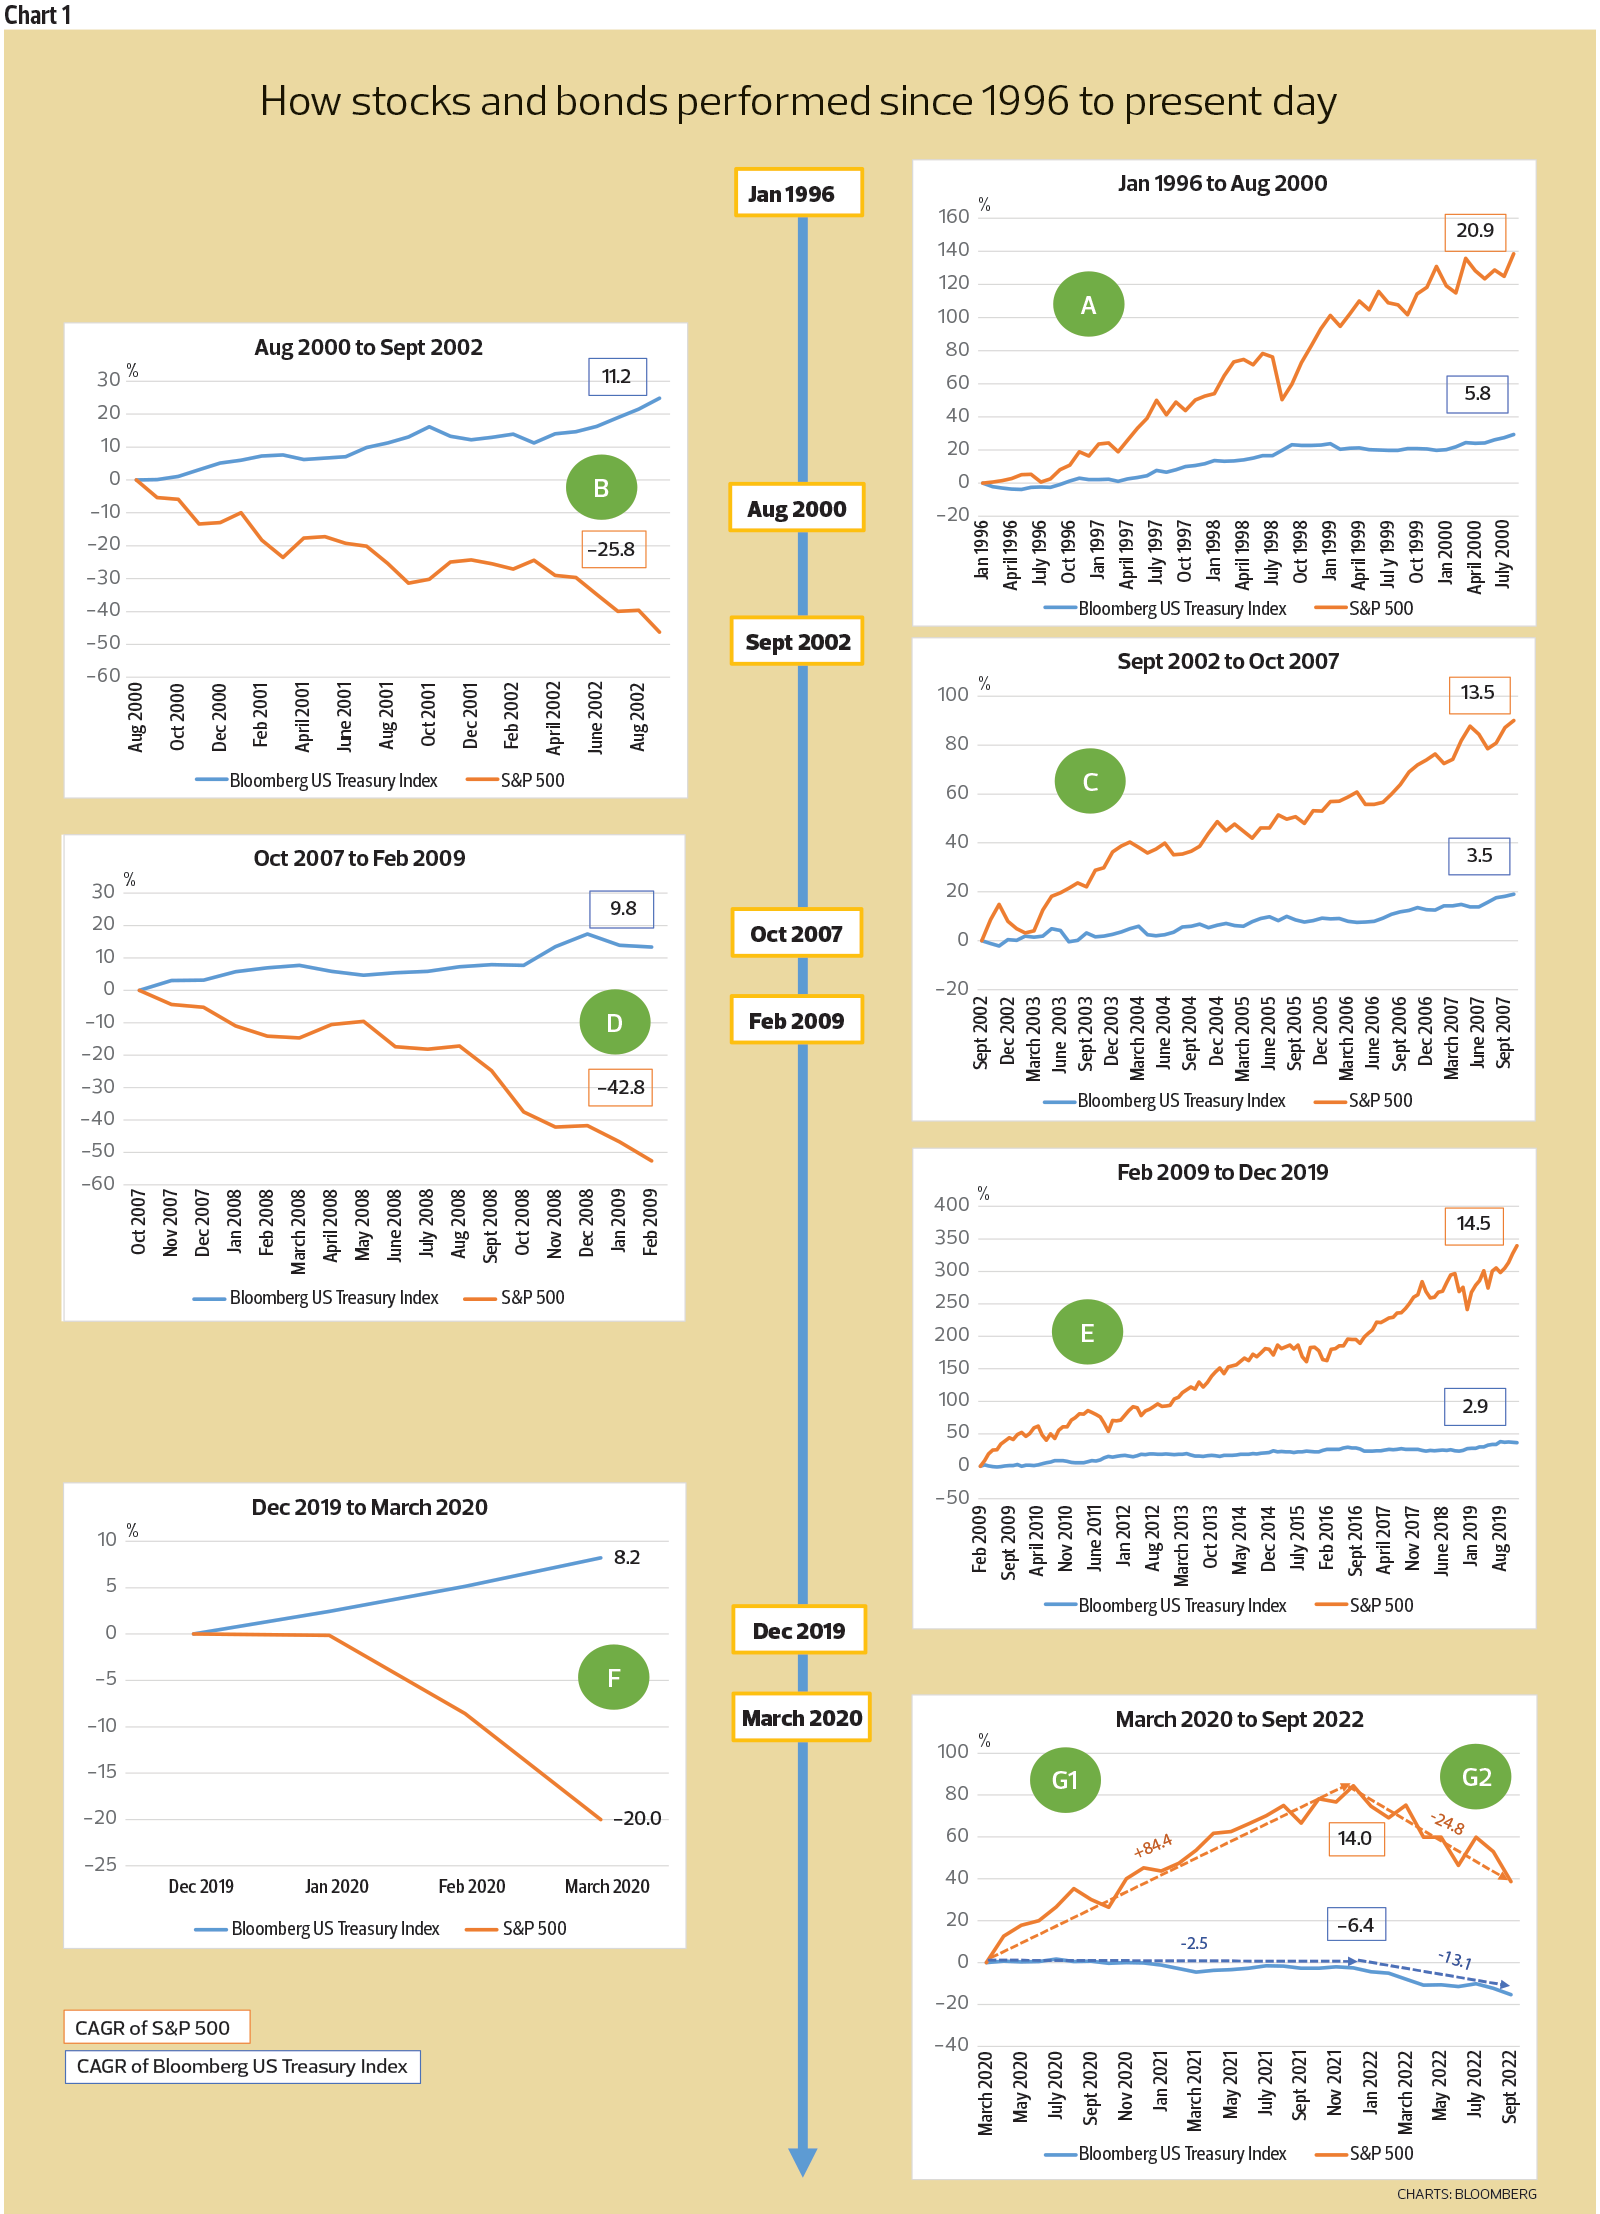
Let’s start with the longer-term horizon. For the past quarter century — from January 1996 to September 2022 — stocks (using the Standard & Poor’s 500 index as proxy) have gained 464% while the returns on bonds (Bloomberg US Treasury index) totalled 172%. What this tells us is that, over this long duration, stocks and bonds were positively correlated. The higher returns for stocks are to be expected, as they are to compensate for higher risks as compared to US Treasuries (which are widely seen as risk-free assets).
Over the past decades, each economic downcycle has been better managed, through the use of both fiscal and monetary policies. As a result, the world saw longer periods of sustained economic growth — leading to greater investor complacency and lower volatility-risk premiums for financial assets. In fact, increasingly interventionist monetary policies created a “Fed put” on the stock market — the widely held belief that the US Federal Reserve will step in to save the market when losses hit some threshold. (Some investors are still hoping for the central bank to quickly pivot as the stock market selloff accelerated, though there is no evidence that it is inclined to do so, this time.)
Worldwide, inflation was in broad decline, thanks to globalisation and its disinflationary effect on prices for goods. Falling inflation, in turn, drove the secular downtrend in interest rates to unprecedented levels, near zero and even negative territory. The use of ultra-expansionary monetary policies, coupled with massive fiscal stimulus during the global financial crisis (GFC) and Covid-19 pandemic, further fanned speculative activities and bubbles across asset classes. These were, no doubt, the golden decades for both stocks and bonds investors.
We saw the longest bond bull market in US history — one that lasted an amazing 40 years (since interest rates peaked in 1981) — as well as the longest rally on record for the US stock market, from 2009 until the onset of the pandemic in early 2020. From January 1996 to the peak in December 2021, stocks gained 649% while bonds returns totalled 213%.
However, the correlation between stocks and bond is more nuanced when observed over specific, shorter periods during this entire 25 or so years. While they have mostly moved in tandem, and in varying degrees depending on the actual periods, there are times when they moved in opposite directions — most notably during major crises. To better show this, we broke the last 25 years up into shorter time periods — which we
labelled A to G for easier reference in Chart 1 — delineated by the dotcom bubble crash, GFC, Covid-19 pandemic and the subsequent recoveries from these events.
Click / Tap image to enlarge.
Interest rate is a key determining factor in stock and bond valuations (prices)
Interest rate, which is the price of money, is a major factor in determining the valuations for stocks and bonds. Mathematically, the intrinsic value (price) for both stocks and bonds is equal to their discounted future cash flows (DCF). The cash flows for stocks are derived from sales and expenses, which are in turn dependent on economic conditions. The cash flows of bonds, on the other hand, are the fixed coupon payments based on the coupon rate. The discount rate takes into account the risk-free interest rate, risk premium and, in the case of stocks, growth.
While the Fed (and other central banks) sets the short-term interest rate (federal funds rate), the longer-term yields for US Treasuries are determined in the bond market, after taking into account the time value of money — longer maturities will have higher yields in normal conditions, though the yield curve does, at times, invert — and inflation expectations. So, in a manner of speaking, the bond market drives the stock market. When inflation expectations are low and declining, yields fall and prices of bonds and stocks rise — this has been the broad trend since the early 1980s until around 2H2020 — and vice versa.
Inflation expectations are very important, as they will have an impact on actual inflation rates — and, accordingly, interest rates. Long-term inflation expectations are influenced by people’s past experiences. For instance, benign inflation over the past decades has conditioned many to believe that inflation will remain low in the future, despite the current, short-term, spike. Conversely, if people start to believe that future inflation will be higher, they will price this into their decisions, thereby driving actual inflation higher. This is why the Fed is hiking rates so aggressively today, to convince the people that inflation will soon be brought down and to ensure that inflation expectations remain “anchored”.
In the shorter term, inflation is largely dependent on prevailing economic conditions. Economic activities are cyclical — from expansion to peak, followed by recession to trough, before beginning on the next upcycle. Where we are in the economic cycle is reflected in the underlying macroeconomic indicators such as GDP growth and unemployment. Generally, inflation is lower during downturns when there is more slack in the economy and higher during expansionary periods as aggregate demand nears the economy’s capacity limits. In other words, demand versus supply.
Click / Tap image to enlarge.
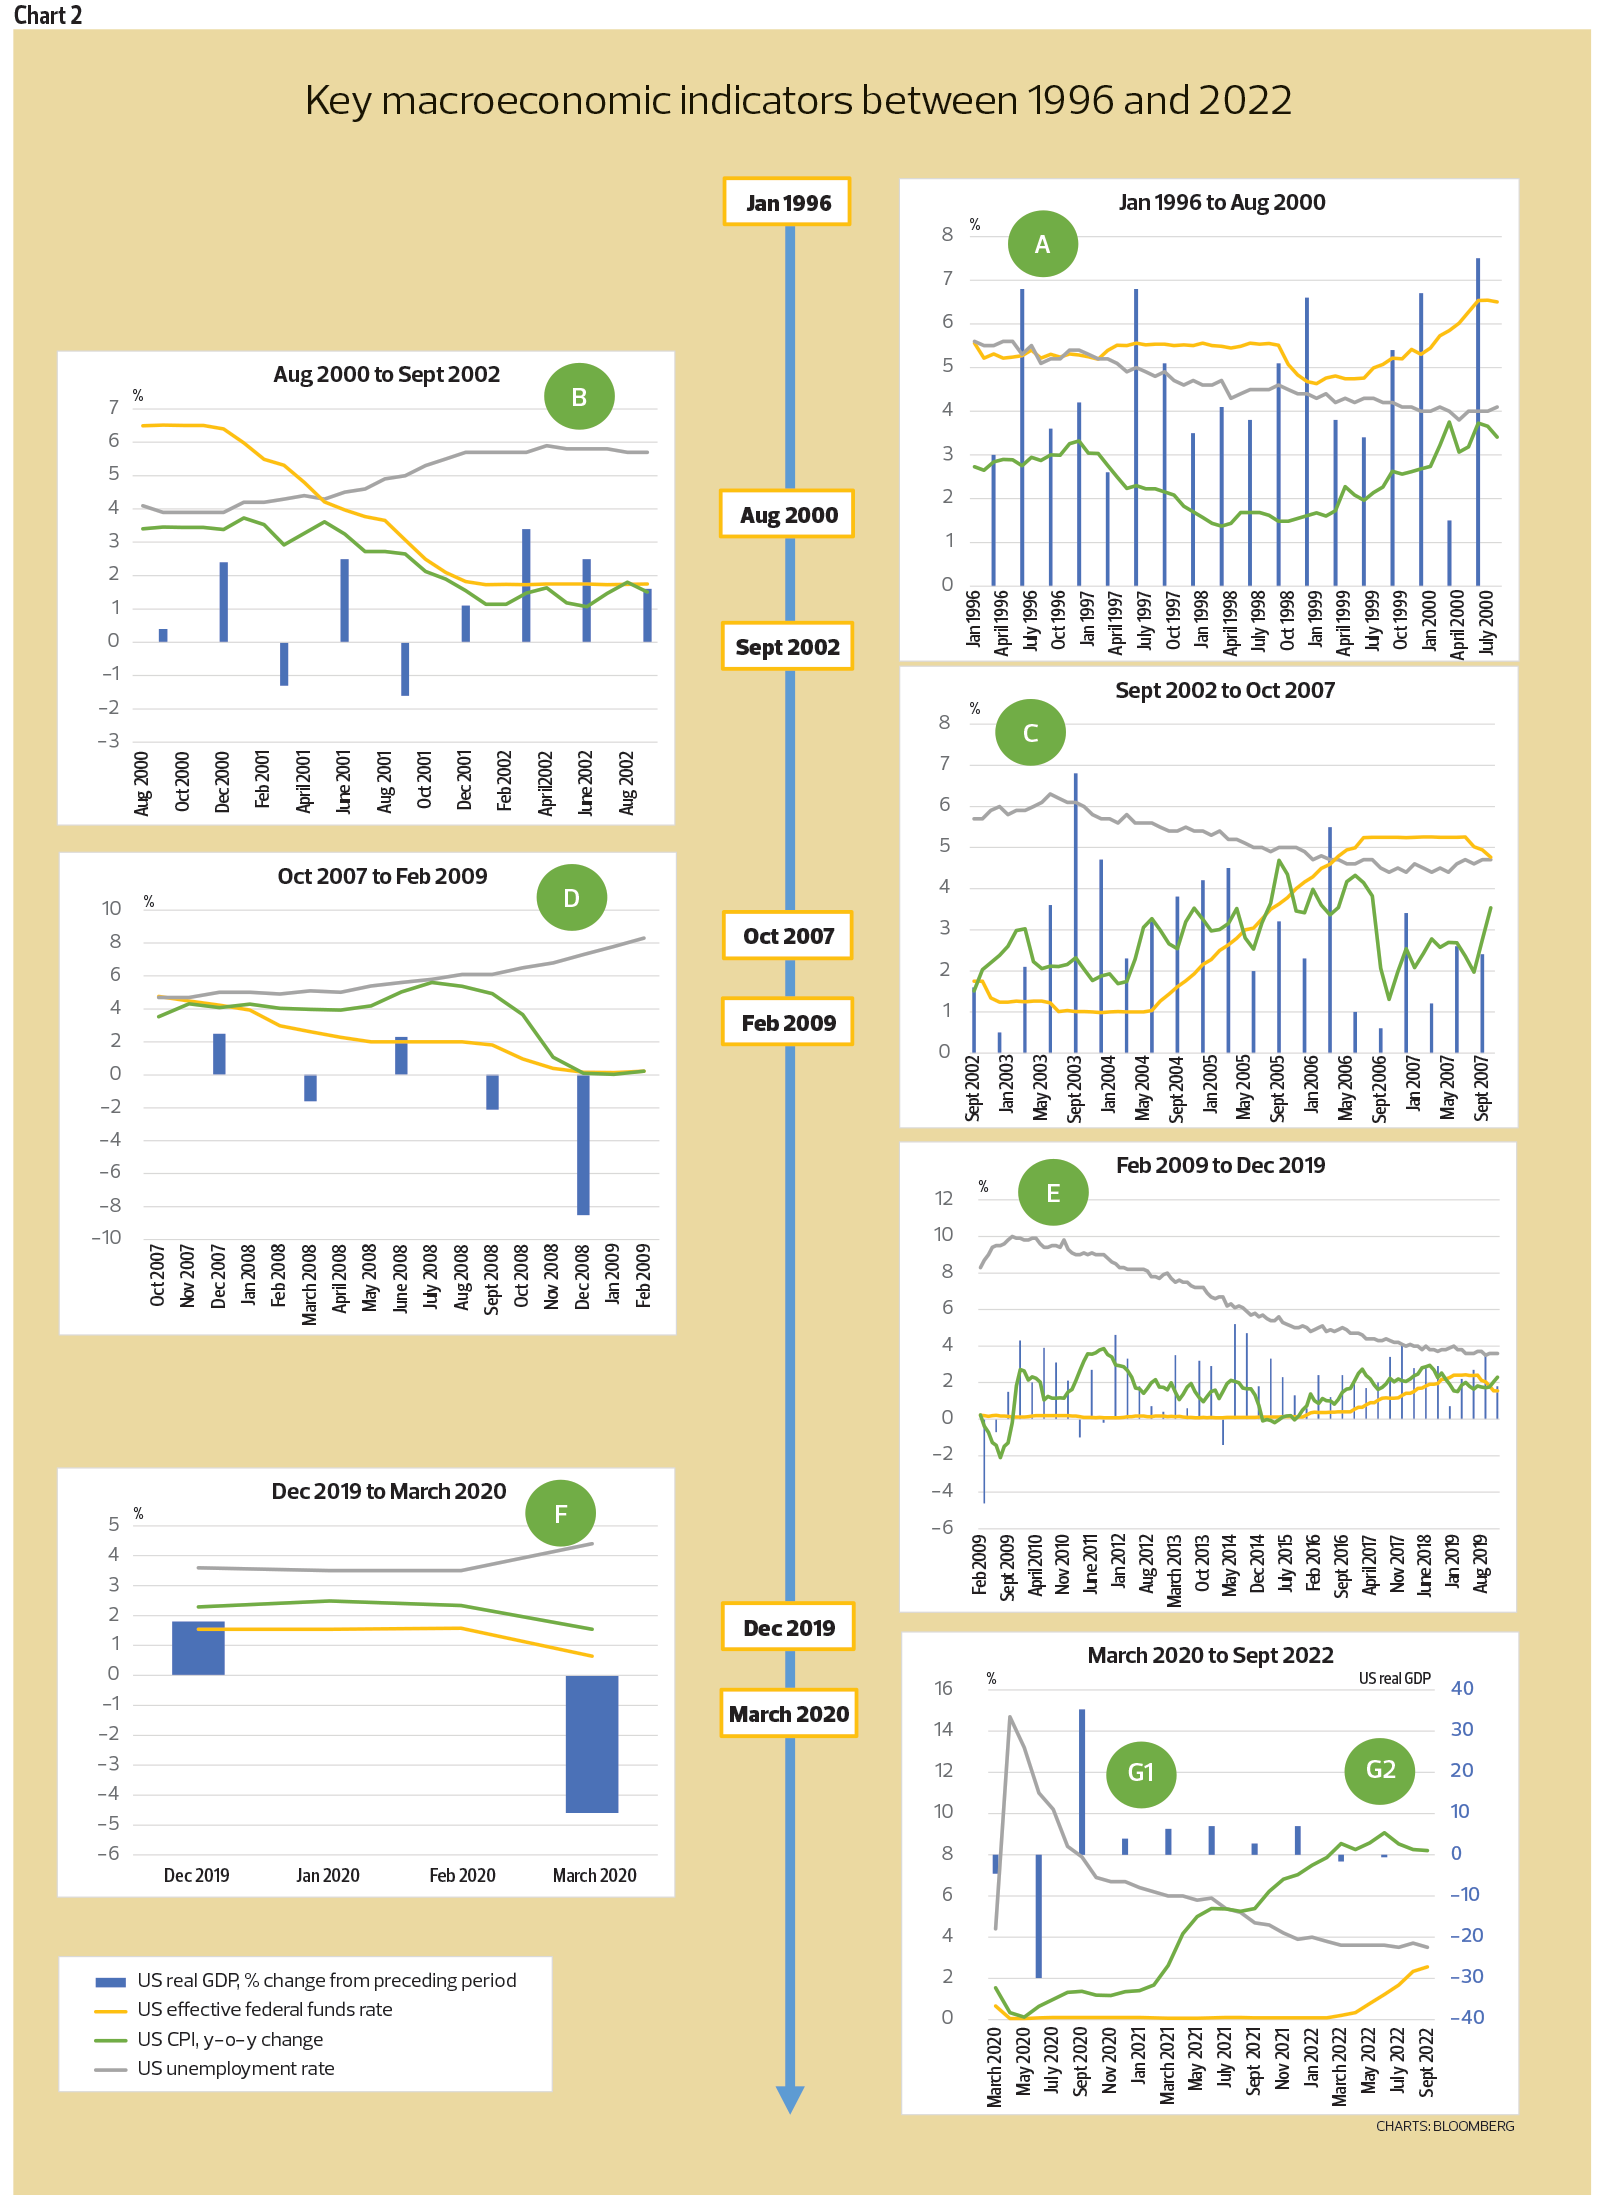
Chart 2 shows the historical statistics for US GDP growth, federal funds rate, inflation and unemployment rate corresponding to the same A to G periods in Chart 1. As these factors change, so too will investors’ inflation expectations, Fed monetary policy and interest rates, as well as projected cash flows of stocks, all of which then feed into prices of stocks and bonds.
Correlation between stocks and bonds is more nuanced over shorter time periods
As mentioned above, the correlation between stocks and bonds is more nuanced over shorter periods of time, its longer-term positive correlation notwithstanding. This is most notable during major crises when the correlation turns negative. Case in point: During the last three major crises — the dotcom bubble crash (B), GFC (D) and pandemic (F) — bond prices rose while stocks fell. That is, bonds outperformed stocks. Why?
During times of crises — times of great uncertainty — investors tend to have a low appetite for risks (often called “risk-off” periods). Risk-off periods hit stocks harder, owing to higher uncertainty for earnings — thus, investors demand a higher risk premium to compensate for the unknown. In addition, crises typically trigger a slowdown in economic activities and rising unemployment, which, in turn, means weaker demand and therefore, lower sales, earnings and growth. In short, it is a double whammy — higher risk premium-discount rate and lower cash flows — for stocks.
Bond coupon payments, on the other hand, offer certainty in terms of future cash flows. Furthermore, as economic activities slow, inflation will decline, allowing central banks to cut interest rates to stimulate demand. Lower interest rates translate into higher DCF valuations (price) for the bonds’ fixed income streams (this explains why bond prices are inversely correlated to interest rates). This was what transpired during all three crises (see Chart 2). Eventually, the economy recovers.
The years following major crises are the “good times” (A, C, E and G1), periods of sustained GDP growth. Both stocks and bonds do well coming out of a downturn, with inflation and interest rates staying low for some time. Remember, low interest rates boost DCF values, hence the positive correlation between stocks and bonds — except that, now, stocks far outperform bonds.
Unemployment falls as the economy recovers, boosting demand, sales and earnings-cash flows for stocks. Expectations for future cash flows and growth rise and, as investors grow more optimistic, they take on more risks (risk on). Lower risk premiums, coupled with stronger earnings-cash flows, translate into outsized valuation improvements — and therefore prices — for stocks.

Inevitably, though, rapid economic growth will drive inflation higher again. This will prompt the Fed to step on the brakes, to prevent the economy from overheating, by raising interest rates. Bond investors will anticipate this by selling in advance of the actual rate hikes. Remember, higher interest rates will definitely reduce the value (price) of bond’s fixed cash flows. Stocks, generally, will continue to fare better in this environment (late expansion cycle) — businesses can raise selling prices (to varying degrees, depending on pricing power) as long as demand remains robust. Until the next crisis-recession hits. We see this pattern repeated in A, C, E and G1.
Of note, excessive liquidity since the GFC — from quantitative easing (QE) — and risk-taking (with cheap money) have fuelled speculation in stocks, including in loss-making, high-growth tech companies and meme stocks, as well as digital assets such as cryptocurrencies and non-fungible tokens (NFTs). As a result, we see magnified outperformance for stocks relative to bonds — in periods E and G1 compared with earlier periods A and C.
Positive correlation — to the downside — in 2022


The year 2022 saw a steep reversal in fortunes — and huge losses — for both stocks and bonds (G2) (see Chart 3). This positive correlation, now to the downside, is divergent from previous periods in the past 25 years. The bond market — including US Treasuries, which are, historically, the go-to risk-off assets — is no longer providing the safety net many would have expected going into a recession. On the contrary, the bond market is heading into what might just be its worst year in history. And that is principally because inflation is now rising steeply, to levels unseen since the early 1980s. This time, it is a double whammy for bonds, particularly long-dated ones.
Higher interest rates, as we explained, translate into lower valuations for bonds and stocks. Long-dated bonds (Bloomberg US Treasury 20+ Year index) are hit harder than short-dated ones (Bloomberg US Treasury Bellwethers 2 Year index), because their DCF values (cash flows further in the future) will fall by more. This is the same reason that high-growth, high-valuation stocks suffered the worst selloff this year. The Nasdaq Composite fell more than the broader-based S&P 500 index. They were all the biggest beneficiaries of the era of low and falling interest rates, which are now reversing steeply.
In fact, the bond market peaked well before stocks, back in July 2020 — when inflation expectations started gathering steam, well before any actual Fed rate hikes (which started in March 2022). Bond investors were already selling out, even as stocks continued to rally.
In the US, inflation is being driven sharply higher by robust consumer demand amid supply constraints, including wages for labour, owing to the pandemic and war in Ukraine. As a result, the Fed has been forced to raise interest rates aggressively, after keeping them too low for too long, to regain control of inflation. Where do we go from here?
Bonds will recover faster than stocks, and long-dated bonds will outperform
If the Fed is successful in bringing inflation under control — and there are early signs that the economy is slowing, including weakening housing sales-building starts, manufacturing and services PMI (Purchasing Managers’ Index) — then the worst of the rate hikes may soon be over.
Current market consensus expects the federal funds rate to peak at 4.5% to 5% by early 2023. The short-dated 3-month Treasury bills are now trading at an implied yield of around 4.2%, which is, in fact, slightly higher than that of the longer-dated 10-year bonds. The spread between the two (10-year yield minus 3-month yield) has been in negative territory for several days, around -0.12% on Oct 31. Historically, similar negative yield spread (what is termed “rates inversion”) occurred around the same time as peak federal funds rates, and preceded the last four recessions by six to 12 months (see Chart 4).
If this historical trend holds (and we have every reason to believe it will — there are economic and rational reasons for it but we will not delve into it here to avoid further confusing our readers), then the current cycle of Fed rate hikes — and yields — are nearing the peak, in which case, the worst should also be over for bonds, soon. Interest rates are, however, quite likely to remain higher for longer. (We have previously explained why we think this will be the case, including the effects of deglobalisation.)
During the past three recessions, bonds have risen even as stocks fell — as seen in periods B, D and F in Chart 1. This is because rising unemployment and declining inflation over the course of recession, eventually, allowed the Fed to lower interest rates. Falling interest rates will enhance the DCF values for bonds, especially long-dated ones. Bond investors would anticipate this and bond prices rise ahead of the actual Fed rate cut. Bond investors are much more sophisticated than stock investors. In today’s scenario, we could see a rate cut in 2024, if all goes to plan. And if this is the case, then bond prices would recover, likely within the next six months.
Bonds will recover faster than stocks because higher borrowing costs will continue to exert a toll on the economy, and corporate earnings. Although we think the current selloff in stocks may have, largely, factored in lower valuation multiples, owing to higher interest rates, businesses still have to grapple with the economic slowdown (and most probably recession next year) and earnings contraction. Eventually, we will see a more sustained recovery in the stock market as the economy recovers — as we saw in previous periods A, C, E and G1.
Of course, things may not play out as we anticipate. After all, the quantitative tightening that is only now starting to unfold is unprecedented. It is possible that demand for US Treasuries could weaken, particularly from major foreign buyers such as Japan and China, owing to changes in domestic monetary policy, geopolitics, concerns over the weaponisation of the US dollar and so on. It was reported that Japan, China and India had sold Treasuries in recent weeks to support their domestic currencies against the turbo-charged US dollar, which itself may be a deterrent for other potential buyers. Add the above to the absence of Fed buying (allowing its holdings of Treasuries and mortgage-backed securities to mature without reinvesting proceeds), and bond yields could still move higher, especially given record-high levels of US public debt currently. Higher-than-currently-anticipated yields, as we have established, would spell more bad news for the economy, stocks and bond prices.

In the worst-case scenario, the Fed does not hike interest rates sufficiently or pivots too soon and inflation returns with a vengeance. This would be reminiscent of the stagflationary period throughout the 1970s. That was a devastating decade for investors of both stocks and bonds, especially in real terms. If this is the case, short-dated bonds are likely to fare better than long-dated ones. Of course, some stocks would still do well under stagflationary environment, for instance, energy and selected commodity sectors. But, by and large, there will be big losses for the majority of investors.
The Fed is well aware of the consequences of an unfinished job, but it also understands that the full effects of its rate hikes require time to materialise. The situation is further complicated by an ultra-tight labour market that is keeping wage growth comparatively high and consumer spending resilient. These uncertainties make a perfect soft-landing scenario near impossible to achieve.
Heightened uncertainties are reflected in the increased day-to-day volatility in markets — investors are more certain some days that rates are peaking and less certain other days. Last week, investors were more certain that the Fed would slow its rate hikes — yields on the 10-year benchmark Treasury fell back slightly from the recent high of 4.25%, closer to the 4% threshold, while the rebound in US stocks have been even stronger.
On balance, we also think the worst of rate hikes may be behind us. Stocks have rebounded higher in October on the back of this expectation — though we think the latest rally is premature and unsustainable. Prices of bonds, on the other hand, have fallen over the past month and, though currently off the lows, have yet to see any meaningful recovery. Strategically, we would be more inclined to buy bonds. As we explained above, they should see an earlier, sustainable recovery. Of course, we could be wrong and the stock market is right, that the Fed will successfully manage a soft landing — and earnings margins will strengthen next year. Only time will tell. At this point, we will stick to our belief.
This being the case, we decided to sell Apple Inc, whose stock price has held up very well, on the basis that its latest earnings results — while not good — were the most resilient among the worst of Big Tech. We also took an initial position in long-dated bonds, adding the iShares 20+ Year Treasury Bond ETF to the Global Portfolio. We cannot predict the market tops and bottoms — and we accept that we may still be too early in the bond market. Investing is about managing risks and rewards, however, and we will look to build on this position as we restructure the Global Portfolio.
After we made the above transactions (and after this article had been largely finalised), the Fed raised rates by the widely anticipated 75 basis points. Fed chair Jerome Powell indicated that the size of future hikes may be smaller as the central banker assesses the lagging impact (of cumulative hikes of 3.75% this year) on economic activities and inflation. He also emphasised, however, that the terminal rate might ultimately need to be higher than what was projected in September — the median was 4.6% — and, critically, that interest rates would stay high for longer. This effectively dashed market hopes for a quick pivot. In Powell’s words, “Policy needs to be more restrictive, and that narrows the path to a soft landing.” Stocks fell sharply in response while Treasury yields remained flattish. The latest events, by and large, vindicated our current belief — that the worst of the rate hikes is done but probable recession means it is too early to buy stocks — and portfolio positioning.
The Global Portfolio recouped some lost ground, gaining 2% for the week ended Nov 2, better than the MSCI World Net Return Index’s 1.4% loss. This was on the back of strong gains for Yihai International Holding Ltd (+11.1%), Alibaba Group Holding Ltd (+8.2%) and DBS Group Holdings Ltd (+6.1%). On the other hand, Guangzhou Automobile Group Co Ltd fell 2.6% while iShares 20+Year Treasury Bond ETF was down 1.2%. Total portfolio returns since inception now stand at 13.3%, trailing the benchmark index’s 29.1% returns over the same period.
The FBM KLCI was down 0.2% last week while total returns for the all-cash Malaysian Portfolio remained at 120.9% since inception. This portfolio is outperforming the benchmark index, which is down 20.7% over the same period, by a long, long way.
Save by subscribing to us for your print and/or digital copy.
P/S: The Edge is also available on Apple's App Store and Android's Google Play.
- Lee Chong Wei among Magma's newly emerged substantial shareholders after land deal
- ViTrox, Unisem, Atlan, Luxchem, Pantech Global, Chin Hin, Ajiya, Binastra, Magma, IGB REIT, IGB Commercial REIT, Steel Hawk, Perdana Petroleum
- Wall Street turns higher on earnings, signs of softer US tariff stance
- Free influenza vaccines for senior citizens with comorbidities
- Binastra buys 40.8% stake in thermal energy firm, with an eye on gaining controlling stake