

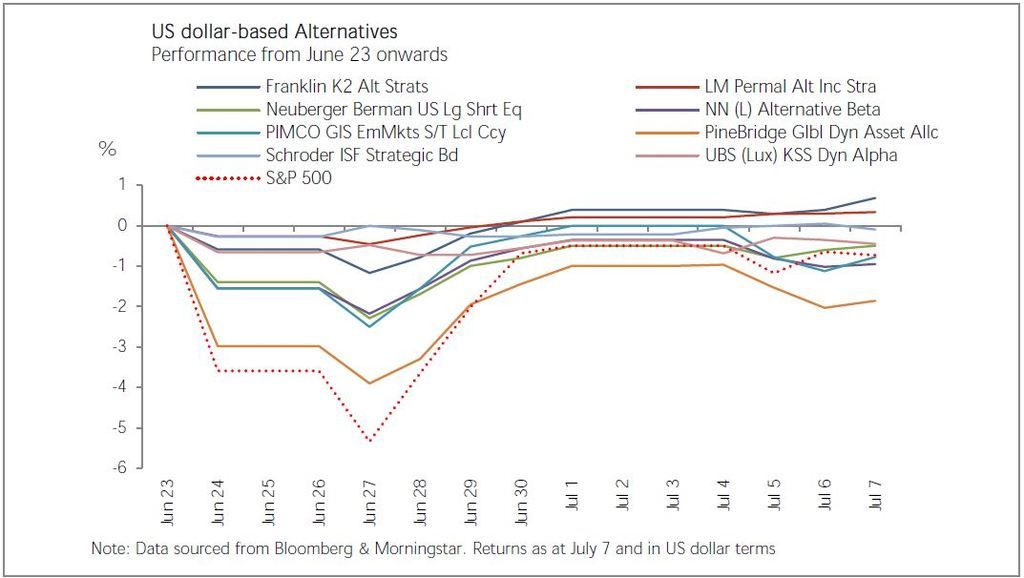
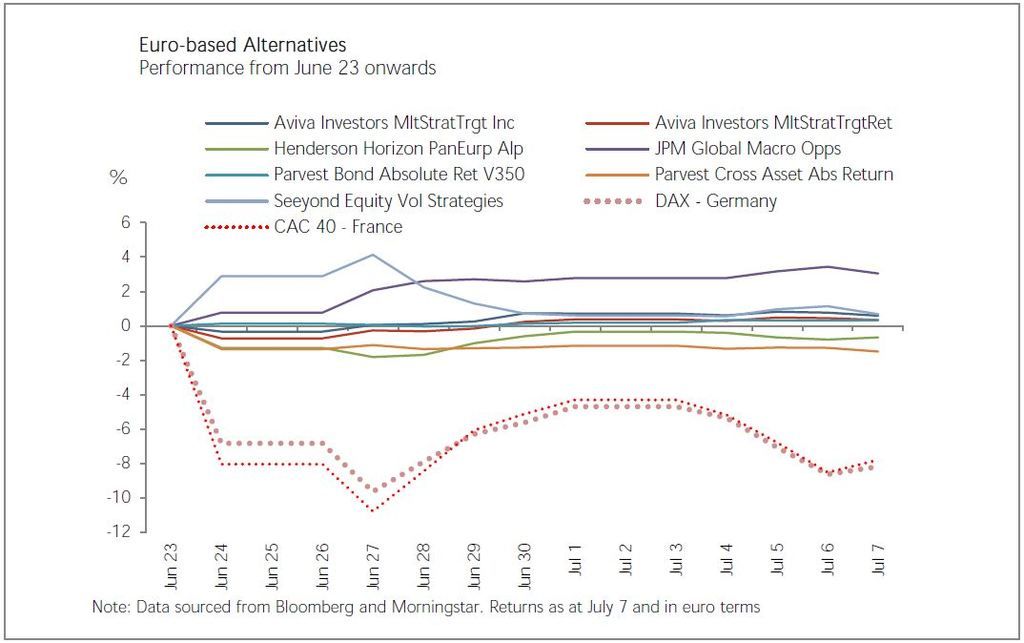
SINGAPORE (July 11): When global financial markets dived in the immediate aftermath of Brexit, alternative funds proved resilient. From June 23 onwards, the S&P 500 index closed 5.3% lower at its worst point while in Europe, Germany’s DAX and France’s CAC indices fell 9.6% and 10.8%, respectively. In contrast, alternatives had materially smaller falls than worldwide equity indices (see charts below) in the same period. Some funds even registered gains.
Among US dollar-based funds, at worst was the 3.9% fall in the $924 million PineBridge Glbl Dyn Asset Allc Y fund which was less severe than the S&P 500’s drop. Meanwhile, the $2.3 billion Schroder ISF Strategic Bd A Acc fund managed the best performance by staying flat.
Euro-based alternatives performed even better. The $209 million Seeyond Equity Vol Strategies I/A EUR and $8.8 billion JPMorgan Global Macro Opps A (acc) EUR funds were stand outs. Both funds actually closed 4.1% and 2.1% higher on June 27 while European indices suffered double-digit declines. The JPMorgan fund has since added to those gains while the DAX and CAC indices are still in the red.
Investors worldwide have piled nearly US$610 billion into alternatives (as at end-May) since the 2008 global financial crisis, according to data from Morningstar Direct. These funds offer exposure to hedge fund-like strategies that aim to minimise downside risks, protect capital and make positive returns in any market condition.
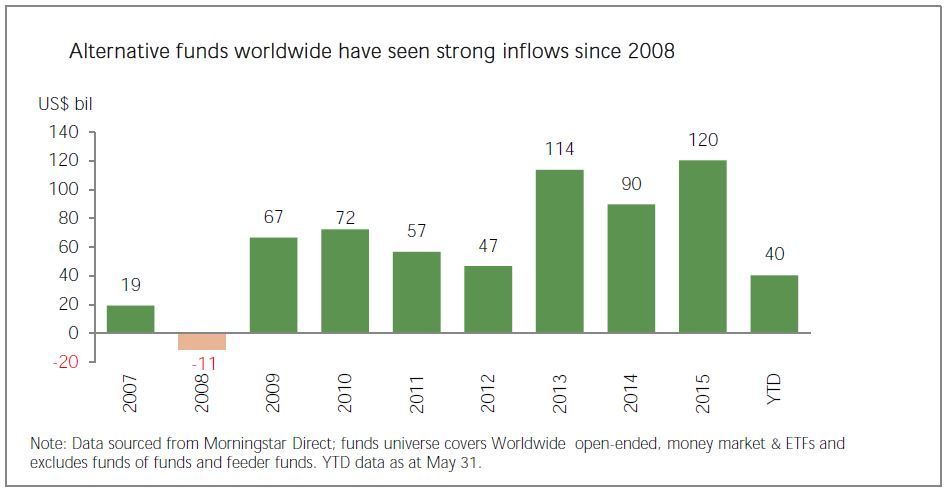
There have been two earlier periods of market stress where alternatives have also proved a hedge against downside volatility. This was in August 2015 and February 2016.
That said, investors seeking outsized gains rather than insurance might consider other asset classes. Over one year, only the JPMorgan Global Macro fund is making money with annualised returns of 3.9%.
Find out more about alternative funds and whether they are a worthwhile investment in Personal Wealth (July 4).
| Alternative funds sold in Singapore | |||||||
| Fund Name | Morningstar Category | Base Currency | Fund Size ($ mil) |
Returns (%) - Base Currency | |||
| Post-Brexit | ytd | 1y | 3y | ||||
| Aviva Investors MltStratTrgt Inc Im€Inc | Multistrategy | Euro | 615 | 0.6 | -0.6 | NA | NA |
| Aviva Investors MltStratTrgtRet I€Acc | Multistrategy | Euro | 4,163 | 0.3 | -1.7 | -1.0 | NA |
| Franklin K2 Alt Strats A Acc USD | Multistrategy | US Dollar | 1,511 | 0.7 | 0.7 | -1.6 | NA |
| Henderson Horizon PanEur Alp A2 € Acc | Long/Short Equity - Europe | Euro | 1,973 | -0.7 | -4.1 | -3.0 | 4.3 |
| JPM Global Macro Opps A (acc) EUR | Multistrategy | Euro | 8,826 | 3.0 | 2.2 | 3.9 | 9.4 |
| LM Permal Alt Inc Stra A USD Acc | Multistrategy | US Dollar | 439 | 0.3 | 1.8 | NA | NA |
| Neuberger Berman US Lg Shrt Eq A1 $ Acc | Long/Short Equity - US | US Dollar | 222 | -0.5 | 1.9 | -3.3 | NA |
| NN (L) Alternative Beta P Cap USD | Multistrategy | US Dollar | 182 | -1.0 | -1.0 | -3.4 | 0.9 |
| Parvest Bond Absolute Ret V350 C C | Long/Short Debt | Euro | 777 | 0.3 | -1.7 | -4.2 | -0.6 |
| Parvest Cross Asset Abs Return I | Multistrategy | Euro | 319 | -1.5 | -2.8 | NA | NA |
| PIMCO GIS EmMkts S/T Lcl Ccy E USD Acc | Currency | US Dollar | 59 | -0.8 | 5.8 | -1.5 | -3.4 |
| PineBridge Glbl Dyn Asset Allc Y | Multistrategy | US Dollar | 924 | -1.9 | -4.5 | -7.1 | 2.5 |
| Schroder ISF Strategic Bd A Acc | Long/Short Debt | US Dollar | 2,334 | -0.1 | -0.1 | -2.7 | -1.0 |
| Seeyond Equity Vol Strategies I/A EUR | Volatility | Euro | 209 | 0.7 | -1.0 | -1.9 | -2.6 |
| UBS (Lux) KSS Dyn Alpha USD P | Global Macro | US Dollar | 1,000 | -0.5 | -3.8 | -10.1 | -1.0 |
| Notes: Data sourced from Morningstar Direct. Returns as at July 7 and in fund's base currency. 3y returns are annualised | |||||||
- MetMalaysia can issue quake warnings within eight minutes, says DG
- Businessman with 'Tan Sri' title, said to be O&G industry veteran, arrested for RM10m scam
- Trump pressing advisers for tariff escalation ahead of April 2, Washington Post reports
- Myanmar hit by fresh 5.1 aftershock, tremors felt in neighbouring countries
- Indonesian Muslims to celebrate Eid on Monday
- Ukraine to seek more US investments in talks over economic deal — Bloomberg
- Businessman with 'Tan Sri' title, said to be O&G industry veteran, arrested for RM10m scam
- Indonesian Muslims to celebrate Eid on Monday
- Myanmar hit by fresh 5.1 aftershock, tremors felt in neighbouring countries
- Myanmar's quake toll passes 1,000 as foreign rescue teams arrive